Airdrie and Shotts
Scotland · County constituency · North Lanarkshire
About the Airdrie and Shotts constituency
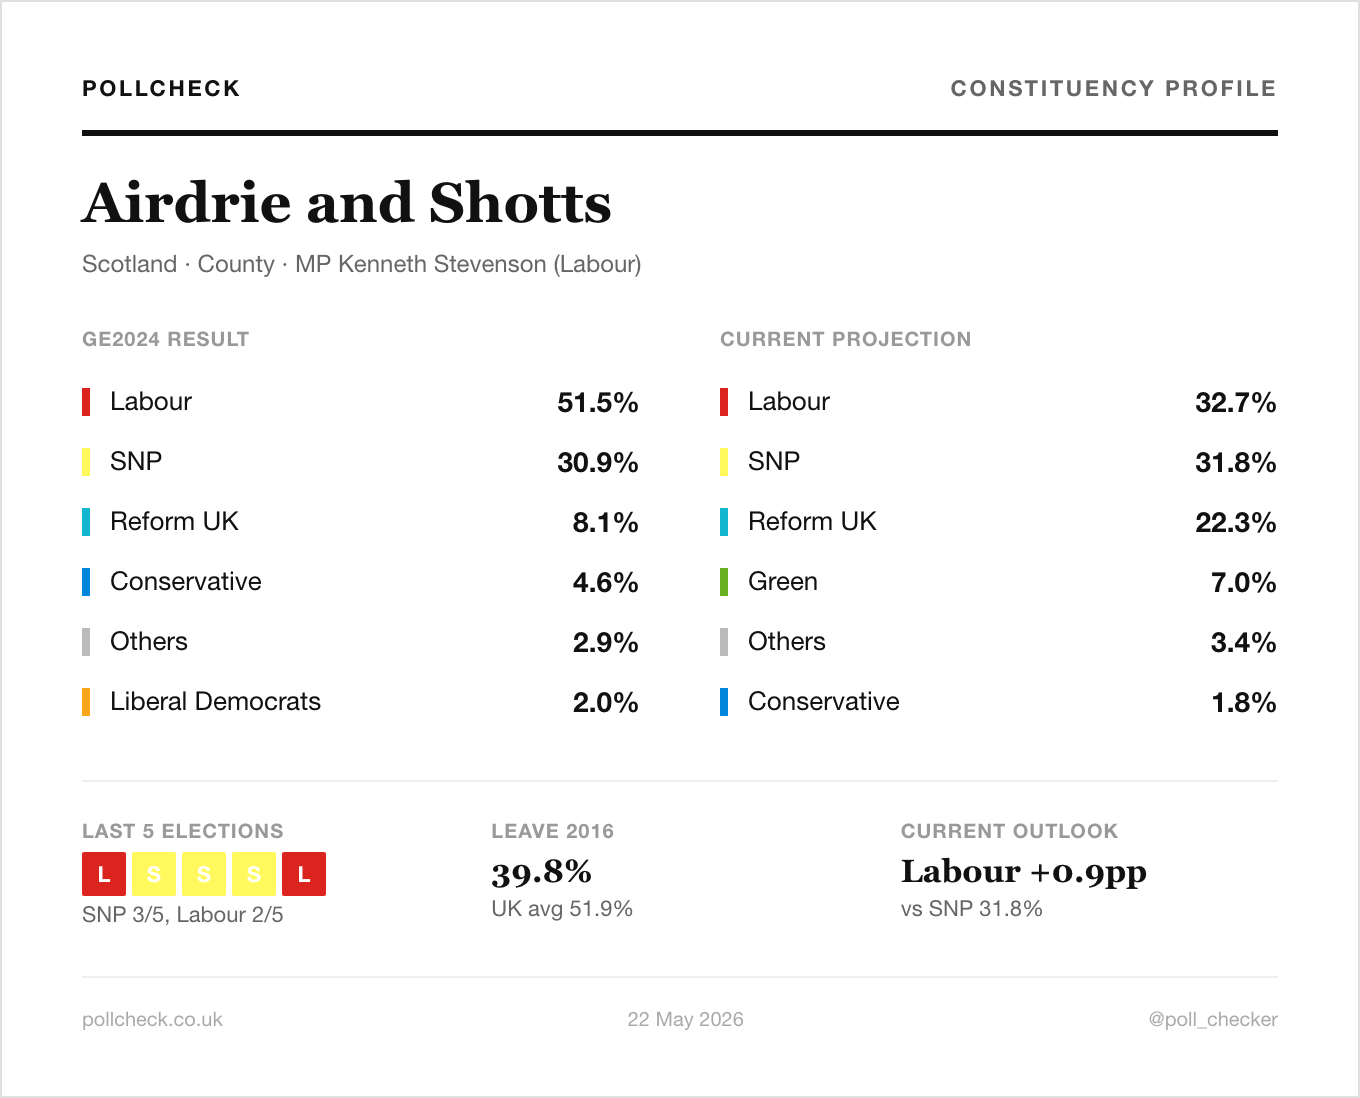
Airdrie and Shotts is a county constituency in Scotland. The sitting MP is Kenneth Stevenson (Labour), MP since July 2024. At the 2024 general election, Labour won with 51.5% to 30.9% for the SNP, a majority of 7,547 votes on a 52.2% turnout. PollCheck's current projection, at the seven-poll average, has the SNP on 31.3% and Labour on 30.6%, a margin of 0.7 points - a projected change of hands from Labour.
Who lives in Airdrie and Shotts? Constituency demographics
From Scotland's 2022 Census and 2016 EU referendum estimates. Constituency-level data on 2024 boundaries.
How did Airdrie and Shotts vote in 2024 and how would it vote now?
2024 vote shares from the HoC Library. Current projection is at the 7-poll average.
2024 general election
Current projection
Map of Airdrie and Shotts
Switch between GE2024 ward winners (modelled estimates, ~4pp average error) and a demographic view from Scotland's 2022 Census. Hover any area for detail. How the map is built ›
How Airdrie and Shotts voted at the Scottish Parliament election (7 May 2026)
Airdrie and Shotts crosses multiple Holyrood boundaries (approximate share of the seat's area in each): Airdrie (87%), Uddingston and Bellshill (5%), Motherwell and Wishaw (4%), Bathgate (1%). Scotland uses the Additional Member System: voters cast one ballot for a constituency MSP and a second for a regional list. The figures below are the constituency vote.
| Holyrood constituency | Approx. share of Airdrie and Shotts's area | Winner | Runner-up | Elected MSP |
|---|---|---|---|---|
| Airdrie | 87% | SNP 42.0% | Labour 24.3% | Neil Gray |
| Uddingston and Bellshill | 5% | SNP 41.5% | Labour 29.1% | Steven Bonnar |
| Motherwell and Wishaw | 4% | SNP 43.7% | Labour 23.6% | Clare Adamson |
| Bathgate | 1% | SNP 40.7% | Labour 24.0% | Pauline Stafford |
Holyrood 2026 constituency results from official declarations. Overlap percentages are approximate shares of the Westminster seat's land area, not of its electorate. They come from an area overlay of the post-2024 Westminster boundary on simplified Holyrood second-review boundaries (in force from 7 May 2026), so they do not always sum to 100% and small overlaps may be artefacts of the simplified boundaries.
Airdrie and Shotts within North Lanarkshire
Airdrie and Shotts sits entirely within North Lanarkshire Council. North Lanarkshire was not due to vote in 2026, so the figures below are the most recent ward results with vote counts available. About this layer ›
Council overlap
| Council | Share of seat |
|---|---|
| North Lanarkshire | 100% |
Recent council by-elections
Council ward by-elections held inside this seat, most recent first. The result column shows which party won; the share column shows the top three parties’ vote shares on the day.
| Date | Ward | Result | Top 3 vote shares |
|---|---|---|---|
| 10 Oct 2024 | Fortissat | Lab HOLD | Lab 37% Other 35% SNP 20% |
| 10 Oct 2024 | Mossend and Holytown | Lab HOLD | Lab 36% SNP 35% Ref 16% |
Most recent council ward results
Latest council result per ward, from the most recent election with vote counts available. How this table is sourced ›
Scottish council wards elect several councillors each by STV, so for these wards the table shows first preferences, not seats: the party with the most first-preference votes and each other party's share. 2022 figures are from the official cast-vote records.
| Ward | GE2024 winner | Latest council first preferences | Shift since GE2024 | Turnout |
|---|---|---|---|---|
| Airdrie Central | Labour 55.5%vs SNP 31.2% | 2022 Labour 42.2%SNP 41.6%, Conservative 13.7%, Others 2.5% | - | 36.9% |
| Airdrie North | Labour 53.3%vs SNP 34.5% | 2022 SNP 36.1%Labour 29.3%, Independent 22.0%, Conservative 10.8%, Lib Dem 1.3%, Others 0.5% | - | 37.0% |
| Airdrie South | Labour 50.9%vs SNP 34.9% | 2022 SNP 47.6%Labour 35.3%, Conservative 17.1% | - | 40.0% |
| Fortissat | Labour 58.2%vs SNP 29.5% | 2022 Labour 36.5%SNP 30.8%, Others 18.8%, Conservative 11.2%, Green 2.6% | - | 37.7% |
| Mossend and Holytown | Labour 53.4%vs SNP 32.5% | 2022 SNP 42.6%Labour 39.4%, Conservative 12.8%, Others 5.2% | - | 36.7% |
| Motherwell North | Labour 52.3%vs SNP 34.5% | 2022 SNP 46.6%Labour 37.3%, Conservative 11.0%, Others 5.0% | - | 38.1% |
| Murdostoun | Labour 53.8%vs SNP 31.4% | 2022 Independent 32.5%SNP 29.7%, Labour 28.7%, Conservative 9.1% | - | 39.5% |
Projection trajectory
PollCheck's projection for Airdrie and Shotts at each of the last 60 GB polls. Hover the chart for the underlying poll details.
Who has won Airdrie and Shotts at past elections?
2024 and notional 2019 rows are on current boundaries; 2010-2017 rows are on the boundaries in force at the time. More on boundaries ›
| Year | Result | MP | Lab | Con | LD | SNP | Majority | Turnout |
|---|---|---|---|---|---|---|---|---|
| 2010 | Lab hold | Pamela Nash | 58.2% | 8.7% | 8.1% | 23.5% | 12,408 | 57.5% |
| 2015 | SNP gain from Lab | Neil Gray | 34.1% | 7.7% | 1.5% | 53.9% | 8,779 | 66.3%+8.8 |
| 2017 | SNP hold | Neil Gray | 37.1% | 23.2% | 2.1% | 37.6% | 195 | 59.2%-7.1 |
| 2019notional | Scottish National Party winner | Neil Gray 2019 MP, pre-review boundary | 33.1% | 17.3% | 3.6% | 44.6% | 5,324 | 65.8%+6.6 |
| 2021by-election | SNP hold | Anum Qaisar-Javed | 38.4% | 12.9% | 1.0% | 46.4% | 1,757 | 34.3% |
| 2024 | Lab gain from SNP | Kenneth Stevenson | 51.5% | 4.6% | 2.0% | 30.9% | 7,547 | 52.2%-13.6 |
Earlier years are on pre-2024 boundaries; comparable results on the new boundary will be added when sourced. By-elections are on the boundaries in force at the time and usually have much lower turnout than a general election.
Constituencies most like Airdrie and Shotts
Five seats with similar demographic profiles to Airdrie and Shotts. Politics shown for context.
- ↓Leave39.8 / 38.8vs 53.2
- ↓Private rent8.3 / 8.2vs 20.2
- ↑Social rent28.2 / 29.3vs 16.8
- ↓Leave39.8 / 36.8vs 53.2
- ↓Private rent8.3 / 8.0vs 20.2
- ↑Social rent28.2 / 30.7vs 16.8
- ↓Private rent8.3 / 8.3vs 20.2
- ↓Leave39.8 / 41.2vs 53.2
- ↑Social rent28.2 / 25.8vs 16.8
- ↓Leave39.8 / 38.0vs 53.2
- ↓Private rent8.3 / 8.1vs 20.2
- ↑Social rent28.2 / 33.5vs 16.8
- ↓Leave39.8 / 39.5vs 53.2
- ↓Private rent8.3 / 9.8vs 20.2
- ↑Social rent28.2 / 24.4vs 16.8
What would change this seat?
Move the sliders to set national vote shares. The per-seat projection updates live. Reset returns to the current 7-poll average.
Related
Sources
Every figure on this page is computed from the sources below. Read the full methodology ›
Show full source list
- 2024 general election results · UK Parliament Election Results portal and House of Commons Library briefing CBP-10009.
- Notional 2019 results on 2024 boundaries · UK Parliament Election Results portal. Recalculated by Parliament; carries assumptions about how 2019 voters would have distributed across the redrawn boundaries.
- Historic general election results (2010-2017) · House of Commons Library historic results files (on the boundaries in force at the time).
- Ward-level GE2024 estimates · Britain Elects / New Statesman - article by Ben Walker, underlying spreadsheet. Modelled from constituency totals; average ~4pp per-ward MoE.
- May 2026 council ward results · Democracy Club via PollCheck's locals 2026 dataset.
- Earlier council ward results (2014-2024) · DCLEAPIL v1.0 (Jason Leman, drawing on Andrew Teale's LEAP dataset and Democracy Club).
- Demographics · ONS Census 2021 (England and Wales), aggregated to constituency level using the ONS LSOA21 -> PCON24 best-fit lookup.
- EU referendum 2016 estimates · Constituency-level Leave vote estimates (Hanretty 2017 method).
- MP details and Cabinet roles · UK Parliament Members API. MP photos are fetched live from the same source.
- Boundary geometry and lookups · ONS Open Geography Portal (PCON24 boundaries, LSOA21 boundaries, LSOA21-WD24-LAD24 best-fit lookup).
- Current projection and trajectory · PollCheck's demographic model at the rolling 7-poll average from aggregated GB polls, built from the British Election Study Internet Panel (Fieldhouse et al.), Census 2021 (ONS) and Scotland's Census 2022 (NRS). The trajectory was recalculated with the current model, introduced in autumn 2026.
If you spot a data issue, please let us know.