South Ribble
North West · County constituency
About the South Ribble constituency
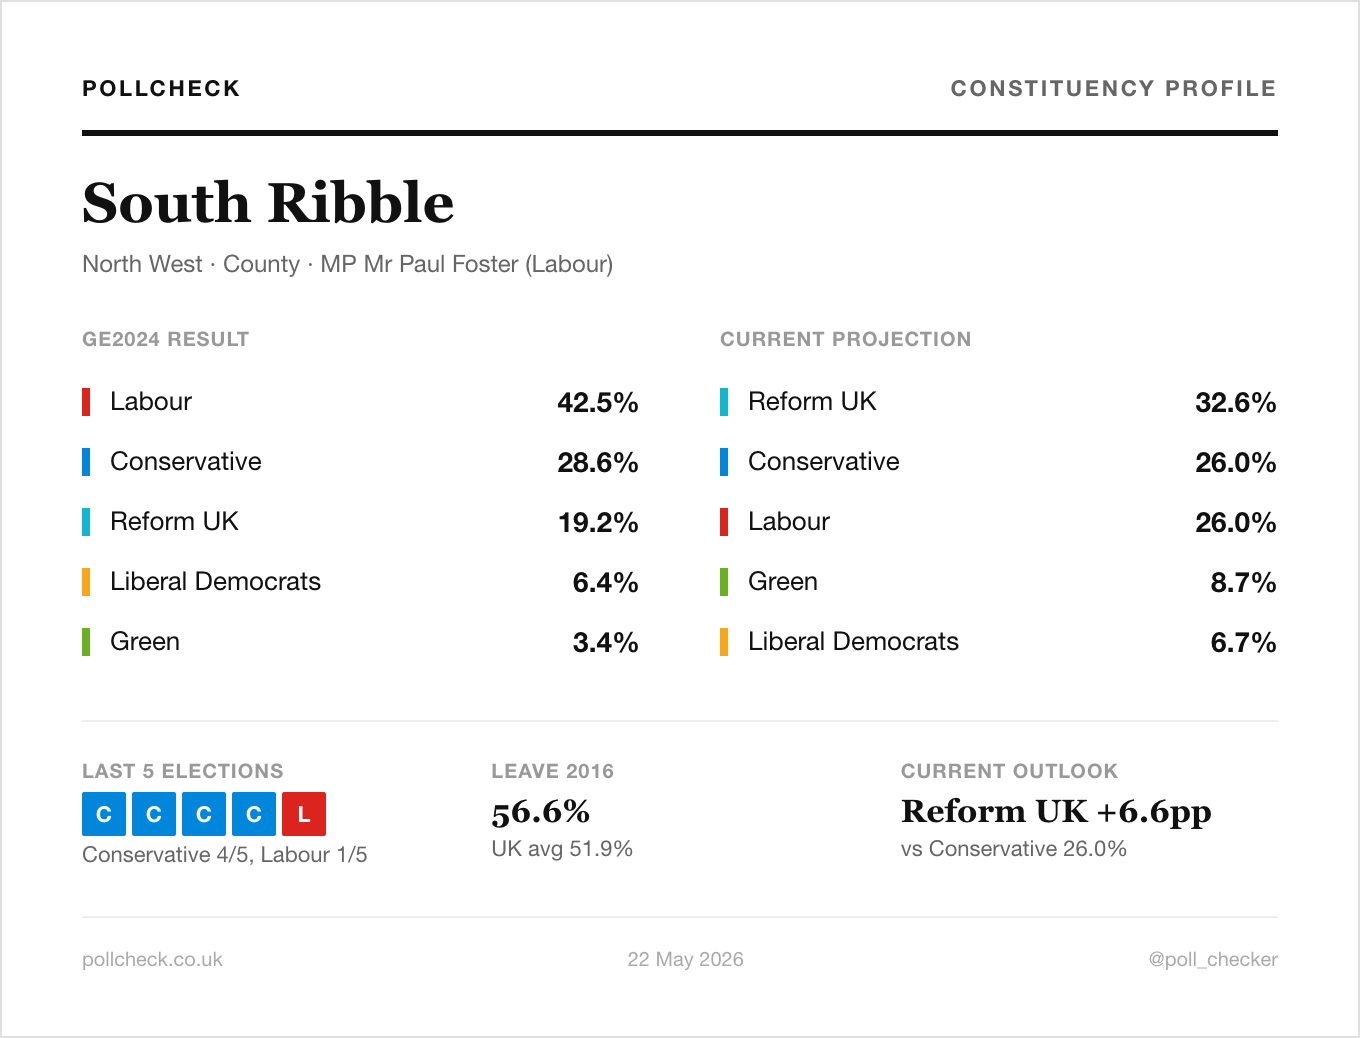
South Ribble is a county constituency in the North West. The sitting MP is Mr Paul Foster (Labour), first elected in July 2024. At the 2024 general election, Labour won with 42.5% to 28.6% for the Conservatives, a majority of 6,501 votes on a 63.6% turnout. PollCheck's current projection, at the seven-poll average, has Labour on 38.5% and Reform UK on 28.0%, a margin of 10.5 points.
Who lives in South Ribble? Constituency demographics
From the 2021 Census and 2016 EU referendum estimates. Constituency-level data on 2024 boundaries.
How did South Ribble vote in 2024 and how would it vote now?
2024 vote shares from the HoC Library. Current projection is at the 7-poll average.
2024 general election
Current projection
Map of South Ribble
Switch between GE2024 ward winners (modelled estimates, ~4pp average error) and a demographic view from the 2021 Census. Hover any area for detail. How the map is built ›
South Ribble within South Ribble and Chorley
South Ribble crosses council boundaries: South Ribble (83%), Chorley (17%). The figures below are from the 7 May 2026 council elections where held, otherwise the most recent available ward result. About this layer ›
Council overlap
| Council | Share of seat | Projection |
|---|---|---|
| South Ribble | 83% | — |
| Chorley | 17% | View projection › |
Recent council by-elections
Council ward by-elections held inside this seat, most recent first. The result column shows which party won; the share column shows the top three parties’ vote shares on the day.
| Date | Ward | Result | Top 3 vote shares |
|---|---|---|---|
| 18 Dec 2025 | Broad Oak | LD HOLD | LD 66% Ref 21% Con 8% |
| 28 Oct 2024 | Middleforth | Con GAIN from Lab | — |
Most recent council ward results
Latest council winner per ward - May 2026 results where the council voted, otherwise the most recent available result. How this table is sourced ›
| Ward | GE2024 winner | Latest council winner | Shift since GE2024 | Turnout |
|---|---|---|---|---|
| Broad Oak | Labour 34.9%vs Conservative 26.3% | 2023 Lib Dem 73.4%vs Conservative 16.9% | - | 41.6% |
| Broadfield | Labour 51.3%vs Reform 20.8% | 2023 Labour 77.0%vs Conservative 18.4% | - | 23.2% |
| Buckshaw & Worden | Labour 41.9%vs Conservative 28.9% | 2023 Labour 49.5%vs Conservative 44.4% | - | 38.5% |
| Charnock | Labour 46.4%vs Conservative 25.6% | 2023 Labour 57.6%vs Conservative 36.5% | - | 34.0% |
| Croston, Mawdesley & Euxton South | Labour 40.5%vs Conservative 34.2% | May 2026 Conservative 39.2%vs Reform 32.4% | Labour→Conservative +15.3pp | - |
| Earnshaw Bridge | Labour 45.2%vs Conservative 25.4% | 2023 Labour 57.7%vs Conservative 34.1% | - | 29.3% |
| Eccleston, Heskin & Charnock Richard | Labour 48.9%vs Conservative 28.7% | May 2026 Labour 36.7%vs Reform 35.0% | Labour share -12.2pp | 46.8% |
| Farington East | Labour 43.9%vs Conservative 26.7% | 2023 Labour 64.7%vs Conservative 30.2% | - | 27.2% |
| Farington West | Labour 39.0%vs Conservative 30.6% | 2023 Conservative 48.9%vs Labour 43.3% | - | 30.4% |
| Hoole | Labour 38.2%vs Conservative 32.1% | 2023 Conservative 49.4%vs Labour 37.9% | - | 31.8% |
| Howick & Priory | Labour 36.9%vs Conservative 27.2% | 2023 Lib Dem 73.7%vs Conservative 15.0% | - | 47.7% |
| Leyland Central | Labour 47.6%vs Conservative 23.4% | 2023 Labour 68.8%vs Conservative 24.5% | - | 29.8% |
| Longton & Hutton West | Conservative 40.3%vs Labour 33.5% | 2023 Conservative 63.2%vs Lib Dem 21.3% | - | 43.5% |
| Middleforth | Labour 46.7%vs Conservative 23.6% | 2023 Labour 59.0%vs Conservative 24.8% | - | 29.3% |
| Moss Side | Labour 40.1%vs Conservative 32.6% | 2023 Conservative 52.5%vs Labour 47.5% | - | 37.1% |
| New Longton & Hutton East | Labour 35.0%vs Conservative 34.2% | 2023 Conservative 53.6%vs Lib Dem 46.4% | - | 37.2% |
| Seven Stars | Labour 47.9%vs Conservative 22.2% | 2023 Labour 68.3%vs Conservative 27.8% | - | 28.4% |
| St Ambrose | Labour 48.9%vs Conservative 22.1% | 2023 Labour 69.9%vs Conservative 22.6% | - | 33.9% |
Projection trajectory
PollCheck's projection for South Ribble at each of the last 60 GB polls. Hover the chart for the underlying poll details.
Who has won South Ribble at past general elections?
2024 and notional 2019 rows are on current boundaries; 2010-2017 rows are on the boundaries in force at the time. More on boundaries ›
| Year | Result | MP | Lab | Con | LD | Majority | Turnout |
|---|---|---|---|---|---|---|---|
| 2010 | Con gain from Lab | Lorraine Fullbrook | 34.7% | 45.5% | 14.1% | 5,554 | 67.9% |
| 2015 | Con hold | Seema Kennedy | 35.1% | 46.4% | 4.4% | 5,945 | 68.5%+0.6 |
| 2017 | Con hold | Seema Kennedy | 39.3% | 52.9% | 3.8% | 7,421 | 72.4%+3.9 |
| 2019notional | Conservative winner | Katherine Fletcher 2019 MP, pre-review boundary | 36.2% | 53.5% | 7.7% | 8,515 | 68.3%-4.1 |
| 2024 | Lab gain from Con | Paul Foster | 42.5% | 28.6% | 6.4% | 6,501 | 63.6%-4.7 |
Earlier years are on pre-2024 boundaries; comparable results on the new boundary will be added when sourced.
Constituencies most like South Ribble
Five seats with similar demographic profiles to South Ribble. Politics shown for context.
- ↑Owner-occupied76.4 / 76.4vs 61.9
- ↓Private rent11.8 / 11.5vs 20.2
- ↓Social rent10.9 / 11.1vs 16.8
- ↑Owner-occupied76.4 / 74.4vs 61.9
- ↓Private rent11.8 / 11.8vs 20.2
- ↓Under 3525.0 / 24.9vs 30.2
- ↑Owner-occupied76.4 / 73.6vs 61.9
- ↓Private rent11.8 / 12.6vs 20.2
- ↓Under 3525.0 / 24.1vs 30.2
- ↑Owner-occupied76.4 / 77.5vs 61.9
- ↓Private rent11.8 / 10.6vs 20.2
- ↓Social rent10.9 / 10.7vs 16.8
- ↑Owner-occupied76.4 / 76.1vs 61.9
- ↓Private rent11.8 / 13.3vs 20.2
- ↓Social rent10.9 / 9.3vs 16.8
What would change this seat?
Move the sliders to set national vote shares. The per-seat projection updates live. Reset returns to the current 7-poll average.
Related
Sources
Every figure on this page is computed from the sources below. Read the full methodology ›
Show full source list
- 2024 general election results · UK Parliament Election Results portal and House of Commons Library briefing CBP-10009.
- Notional 2019 results on 2024 boundaries · UK Parliament Election Results portal. Recalculated by Parliament; carries assumptions about how 2019 voters would have distributed across the redrawn boundaries.
- Historic general election results (2010-2017) · House of Commons Library historic results files (on the boundaries in force at the time).
- Ward-level GE2024 estimates · Britain Elects / New Statesman - article by Ben Walker, underlying spreadsheet. Modelled from constituency totals; average ~4pp per-ward MoE.
- May 2026 council ward results · Democracy Club via PollCheck's locals 2026 dataset.
- Earlier council ward results (2014-2024) · DCLEAPIL v1.0 (Jason Leman, drawing on Andrew Teale's LEAP dataset and Democracy Club).
- Demographics · ONS Census 2021 (England and Wales), aggregated to constituency level using the ONS LSOA21 -> PCON24 best-fit lookup.
- EU referendum 2016 estimates · Constituency-level Leave vote estimates (Hanretty 2017 method).
- MP details and Cabinet roles · UK Parliament Members API. MP photos are fetched live from the same source.
- Boundary geometry and lookups · ONS Open Geography Portal (PCON24 boundaries, LSOA21 boundaries, LSOA21-WD24-LAD24 best-fit lookup).
- Current projection and trajectory · PollCheck's demographic swingometer applied to the rolling 7-poll average from aggregated GB polls. Not a true MRP - vote-share movements are applied through per-constituency sensitivity multipliers derived from demographic regressions.
If you spot a data issue, please let us know.