Na h-Eileanan an Iar
Scotland · County constituency · Na h-Eileanan Siar borough
About the Na h-Eileanan an Iar constituency
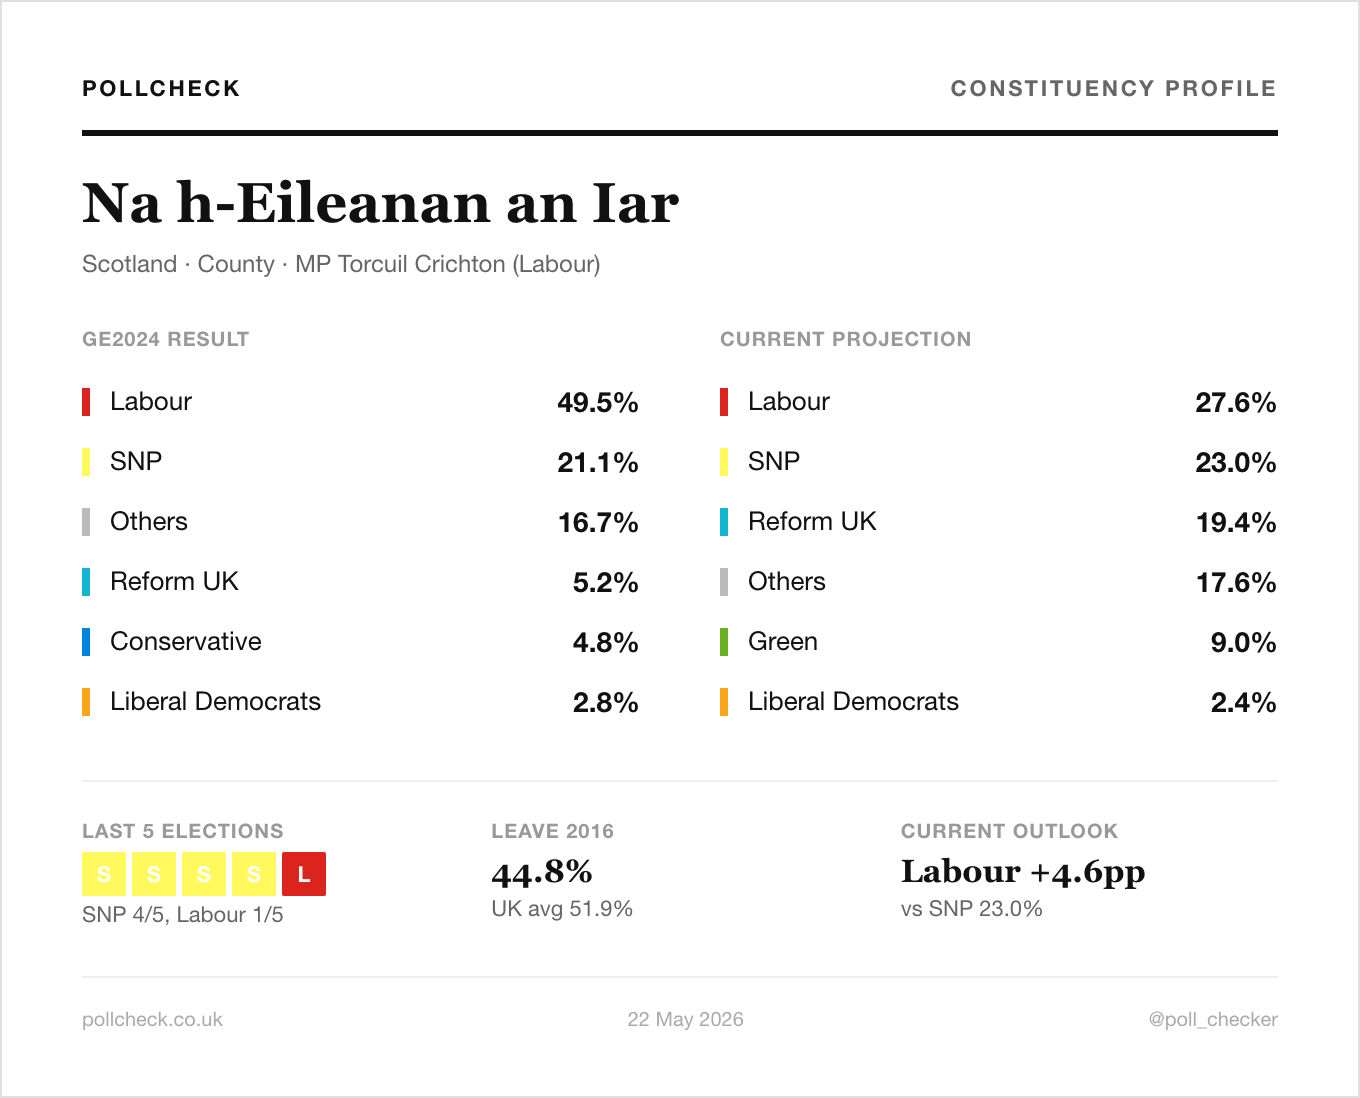
Na h-Eileanan an Iar is a county constituency in Scotland. The sitting MP is Torcuil Crichton (Labour), first elected in July 2024. At the 2024 general election, Labour won with 49.5% to 21.1% for the SNP, a majority of 3,836 votes on a 63.4% turnout. PollCheck's current projection, at the seven-poll average, has Labour on 32.1% and other parties on 22.5%, a margin of 9.6 points.
Who lives in Na h-Eileanan an Iar? Constituency demographics
From the 2021 Census and 2016 EU referendum estimates. Constituency-level data on 2024 boundaries.
How did Na h-Eileanan an Iar vote in 2024 and how would it vote now?
2024 vote shares from the HoC Library. Current projection is at the 7-poll average.
2024 general election
Current projection
Map of Na h-Eileanan an Iar
Pick a metric to colour the map by demographics from Scotland's 2022 Census. Hover any area for detail. How the map is built ›
How Na h-Eileanan an Iar voted at the Scottish Parliament election (7 May 2026)
Na h-Eileanan an Iar sits almost entirely within the Holyrood constituency of Na h-Eileanan an Iar. Scotland uses the Additional Member System: voters cast one ballot for a constituency MSP and a second for a regional list. The figures below are the constituency vote.
| Holyrood constituency | Share of Na h-Eileanan an Iar | Winner | Runner-up | Elected MSP |
|---|---|---|---|---|
| Na h-Eileanan an Iar | 97% | Labour 37.3% | SNP 36.1% | Donald MacKinnon |
Holyrood 2026 constituency results from official declarations. Overlap percentages are area-based using the post-2024 Westminster boundary against the new Holyrood second-review boundary (in force from 7 May 2026).
Na h-Eileanan an Iar within Na h-Eileanan Siar
Na h-Eileanan an Iar sits entirely within Na h-Eileanan Siar Council. Na h-Eileanan Siar was not due to vote in 2026, so the figures below are the most recent ward results available. About this layer ›
Council overlap
| Council | Share of seat |
|---|---|
| Na h-Eileanan Siar | 100% |
Most recent council ward results
Latest council winner per ward - May 2026 results where the council voted, otherwise the most recent available result. How this table is sourced ›
| Ward | GE2024 winner | Latest council winner | Shift since GE2024 | Turnout |
|---|
Projection trajectory
PollCheck's projection for Na h-Eileanan an Iar at each of the last 60 GB polls. Hover the chart for the underlying poll details.
Who has won Na h-Eileanan an Iar at past general elections?
2024 and notional 2019 rows are on current boundaries; 2010-2017 rows are on the boundaries in force at the time. More on boundaries ›
| Year | Result | MP | Lab | Con | LD | Majority | Turnout |
|---|---|---|---|---|---|---|---|
| 2010 | SNP hold | Angus MacNeil | 32.9% | 4.4% | 7.5% | 1,885 | 67.6% |
| 2015 | SNP hold | Angus MacNeil | 28.6% | 7.6% | 2.9% | 4,102 | 73.2%+5.6 |
| 2017 | SNP hold | Angus MacNeil | 33.8% | 16.5% | 1.7% | 1,007 | 69.6%-3.6 |
| 2019notional | Scottish National Party winner | Angus Brendan MacNeil 2019 MP, pre-review boundary | 28.3% | 22.2% | 4.4% | 2,438 | 68.4%-1.2 |
| 2024 | Lab gain from SNP | Torcuil Crichton | 49.5% | 4.8% | 2.8% | 3,836 | 63.4%-5.0 |
Earlier years are on pre-2024 boundaries; comparable results on the new boundary will be added when sourced.
Constituencies most like Na h-Eileanan an Iar
Five seats with similar demographic profiles to Na h-Eileanan an Iar. Politics shown for context.
- ↑Graduate44.2 / 44.1vs 33.7
- ↓Private rent5.7 / 10.6vs 20.2
- ↓Leave44.8 / 43.3vs 53.2
- ↑Graduate44.2 / 46.5vs 33.7
- ↓Under 3520.5 / 20.7vs 30.2
- ↑Age 65+30.9 / 31.4vs 22.7
- ↓Private rent5.7 / 8.3vs 20.2
- ↑Graduate44.2 / 43.5vs 33.7
- ↓Leave44.8 / 40.3vs 53.2
- ↓Private rent5.7 / 8.9vs 20.2
- ↓Under 3520.5 / 21.9vs 30.2
- ↑Age 65+30.9 / 29.9vs 22.7
- ↓Under 3520.5 / 21.3vs 30.2
- ↓Leave44.8 / 44.6vs 53.2
- ↑Age 65+30.9 / 30.3vs 22.7
What would change this seat?
Move the sliders to set national vote shares. The per-seat projection updates live. Reset returns to the current 7-poll average.
Related
Sources
Every figure on this page is computed from the sources below. Read the full methodology ›
Show full source list
- 2024 general election results · UK Parliament Election Results portal and House of Commons Library briefing CBP-10009.
- Notional 2019 results on 2024 boundaries · UK Parliament Election Results portal. Recalculated by Parliament; carries assumptions about how 2019 voters would have distributed across the redrawn boundaries.
- Historic general election results (2010-2017) · House of Commons Library historic results files (on the boundaries in force at the time).
- Ward-level GE2024 estimates · Britain Elects / New Statesman - article by Ben Walker, underlying spreadsheet. Modelled from constituency totals; average ~4pp per-ward MoE.
- May 2026 council ward results · Democracy Club via PollCheck's locals 2026 dataset.
- Earlier council ward results (2014-2024) · DCLEAPIL v1.0 (Jason Leman, drawing on Andrew Teale's LEAP dataset and Democracy Club).
- Demographics · ONS Census 2021 (England and Wales), aggregated to constituency level using the ONS LSOA21 -> PCON24 best-fit lookup.
- EU referendum 2016 estimates · Constituency-level Leave vote estimates (Hanretty 2017 method).
- MP details and Cabinet roles · UK Parliament Members API. MP photos are fetched live from the same source.
- Boundary geometry and lookups · ONS Open Geography Portal (PCON24 boundaries, LSOA21 boundaries, LSOA21-WD24-LAD24 best-fit lookup).
- Current projection and trajectory · PollCheck's demographic swingometer applied to the rolling 7-poll average from aggregated GB polls. Not a true MRP - vote-share movements are applied through per-constituency sensitivity multipliers derived from demographic regressions.
If you spot a data issue, please let us know.