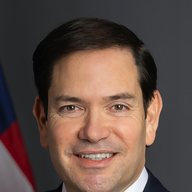
2028 presidential election / Rubio vs. Newsom
Rubio 42.8%, Newsom 44.0%
PollCheck average of national polls from the last 180 days. Updated November 5, 2026.

MarginD+1.23 of 5 polls used
Every poll
5 national polls
Newest first.
| Dates | Pollster | Sample | Rubio | Newsom | Margin | Undec. | Source |
|---|---|---|---|---|---|---|---|
| Nov 5, 2026 | PollCheck average | 3 of 5 polls | 42.8 | 44.0 | D+1.2 | ||
| Oct 2-4, 2026 | YouGovUMass Lowell/YouGov | 1,000 LV | 42 | 44 | D+2 | 13 | Poll |
| Aug 16-17, 2026 | Emerson College | 1,000 LV | 46 | 48 | D+2 | 6 | Poll |
| Jul 1-4, 2026 | Zogby Analytics | 1,003 LV | 40 | 36 | R+4 | 24 | Poll |
| Nov 14-16, 2025 | Morning Consult Not in average | 2,201 RV | 39 | 41 | D+2 | 20 | Poll |
| Aug 29-31, 2025 | Leger360 Not in average | 849 A | 44 | 49 | D+5 | 7 | Poll |
How the average works
The average uses polls from the last 180 days, weighting recent and larger polls more. Each polling house counts once, and partisan-sponsored polls (R or D) count half. Where a poll reports several populations, likely voters are used first. A match-up needs 3 polls from 2 polling houses for an average.
Poll lists adapted from Wikipedia: Nationwide opinion polling for the 2028 United States presidential election (revision 1383801796). Licensed under CC BY-SA 4.0; PollCheck averages are derived from them.
Photos: Gavin Newsom by Charles Ommanney - Office of the Governor of California, CC BY-SA 4.0 (source, cropped); others official portraits, public domain (US government); see Photo credits.
PollCheck US. Data through November 5, 2026. Photo credits