2028 primaries / Republican
Vance first in the Republican field at 37%
PollCheck average of national Republican primary polls. Updated November 5, 2026.
All candidates
Average share in 10 polls from the last 60 days, with the change over 30 days.
 JD Vance37.4%▼0.8
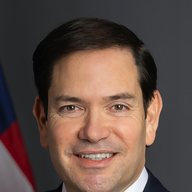 Marco Rubio25.0%▲6.2
 Donald Trump Jr.10.0%▼2.5
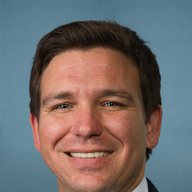 Ron DeSantis7.9%▼0.9
 Robert F. Kennedy Jr.4.8%▼0.5
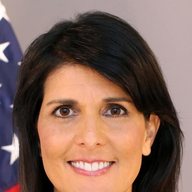 Nikki Haley4.1%▲0.3
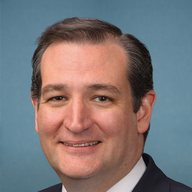 Ted Cruz2.9%▼0.3
- Vivek Ramaswamy1.3%▼0.7
National Republican primary polling average
114 national Republican primary polls
Newest first. A dash means the candidate was not asked.
| Pollster | Dates | Sample | Vance | Rubio | Trump Jr. | DeSantis | Kennedy | Haley | Cruz | Undec. | Source |
|---|---|---|---|---|---|---|---|---|---|---|---|
| AtlasIntel | Oct 28 - Nov 1, 2026 | 3,566 A | 32.9% | 45.6% | 2.3% | 4.5% | - | - | 1.4% | 6.4% | Poll |
| Clarity Campaign Labs | Oct 15-21, 2026 | 413 LV | 40% | 17% | 17% | 9% | 5% | - | 2% | 8% | Wiki |
| Echelon Insights | Oct 15-19, 2026 | 417 LV | 38% | 20% | 7% | 12% | 2% | - | 4% | 10% | Wiki |
| Noble Predictive Insights | Oct 5-7, 2026 | 1,137 RV | 44% | 18% | - | 8% | - | 3% | 5% | 10% | Wiki |
| Focaldata | Oct 2-5, 2026 | 803 LV | 38% | 24% | 7% | 9% | 4% | - | 2% | 12% | Wiki |
| Harvard CAPS/Harris | Sep 26-28, 2026 | - RV | 39% | 17% | 24% | - | 9% | 5% | - | - | Wiki |
| McLaughlin & Associates | Sep 16-22, 2026 | 430 LV | 35% | 15% | 14% | 6% | - | 3% | 3% | 12% | Wiki |
| Echelon Insights | Sep 17-21, 2026 | 424 LV | 38% | 20% | 6% | 8% | 3% | - | 3% | 10% | Wiki |
| Clarity Campaign Labs | Sep 11-16, 2026 | 406 LV | 35% | 16% | 12% | 12% | 5% | - | 3% | 13% | Wiki |
| Big Data Poll | Sep 13-15, 2026 | 1,110 LV | 38% | 16% | - | 8% | 6% | 6% | 4% | 11% | Wiki |
| Focaldata | Aug 28 - Sep 2, 2026 | 662 LV | 43% | 21% | 7% | 9% | 4% | - | 4% | 8% | Wiki |
| YouGov | Aug 25 - Sep 1, 2026 | 499 LV | 44% | 21% | 8% | 7% | 2% | 1% | 3% | - | Wiki |
| Quantus Insights | Aug 26-28, 2026 | 473 LV | 41% | 29% | 9% | 6% | - | - | - | 10% | Wiki |
| McLaughlin & Associates | Aug 18-24, 2026 | 433 LV | 32% | 12% | 19% | 6% | - | 5% | 2% | 9% | Wiki |
| Focaldata | Aug 7-11, 2026 | 874 A | 42% | 18% | 10% | 8% | 6% | - | 3% | 10% | Wiki |
| Emerson College | Jul 19-20, 2026 | - | 39% | 38% | 5% | 5% | - | - | - | - | Wiki |
| Echelon Insights | Jul 9-13, 2026 | 1,004 LV | 38% | 15% | 8% | 9% | 3% | - | 2% | 13% | Wiki |
| Harvard CAPS/Harris | Jul 11-12, 2026 | 1,776 RV | 42% | 22% | 18% | - | 6% | 6% | - | - | Wiki |
| YouGov | Jul 8-10, 2026 | 369 A | 32% | 19% | 11% | 4% | 1% | 2% | 2% | 19% | Wiki |
| Quantus Insights | Jul 3-7, 2026 | 480 LV | 42% | 26% | - | 9% | - | 3% | 4% | 17% | Wiki |
| Zogby Analytics | Jul 1-4, 2026 | 375 LV | 51% | 13% | - | 13% | - | - | 5% | 7% | Wiki |
| Focaldata | Jun 26-30, 2026 | 727 LV | 40% | 18% | 9% | 7% | 5% | - | 2% | 12% | Wiki |
| Big Data Poll | Jun 26-28, 2026 | 1,166 LV | 37% | 18% | - | 8% | 7% | 4% | 5% | 10% | Wiki |
| JL Partners/Daily Mail Not in average | Jun 24-26, 2026 | 517 LV | 51% | 15% | - | 9% | - | 2% | 6% | - | Wiki |
| McLaughlin & Associates | Jun 17-23, 2026 | 440 RV | 35% | 15% | 14% | 5% | - | 3% | 3% | 12% | Wiki |
| Echelon Insights | Jun 11-14, 2026 | 418 LV | 42% | 15% | 7% | 6% | 3% | - | 2% | 13% | Wiki |
| Echelon Insights | Jun 5-9, 2026 | 1,121 LV | 38% | 19% | 13% | 7% | 3% | - | 3% | 7% | Wiki |
| Noble Predictive Insights Not in average | Jun 1-4, 2026 | 1,046 RV | 36% | 17% | - | 7% | - | 3% | 5% | 17% | Wiki |
| Focaldata | May 29 - Jun 1, 2026 | 667 A | 37% | 18% | 10% | 9% | 5% | - | 3% | 12% | Wiki |
| Harvard CAPS/Harris | May 29-31, 2026 | 1,725 RV | 45% | 21% | 21% | - | - | - | - | - | Wiki |
| TIPP Insights | May 26-28, 2026 | 561 RV | 29% | 12% | 19% | 6% | 4% | 2% | 3% | 15% | Wiki |
| Big Data Poll | May 24-27, 2026 | 1,148 LV | 37.4% | 16.1% | - | 7.2% | 5.9% | 3.8% | 3.3% | 13.1% | Wiki |
| Emerson College | May 24-25, 2026 | 432 LV | 35.5% | 34.6% | - | 5.4% | 3.1% | 4.6% | 0.7% | 15% | Wiki |
| Overton Insights | May 16-20, 2026 | 509 | 39% | 32% | - | 9% | - | 4% | - | 6% | Wiki |
| Daily Mail /JL Partners | May 15-19, 2026 | 496 LV | 47% | 18% | - | 9% | - | 3% | 4% | - | Wiki |
| Echelon Insights | May 14-18, 2026 | 418 LV | 36% | 12% | 6% | 12% | 2% | - | 2% | 15% | Wiki |
| McLaughlin & Associates | May 12-18, 2026 | 431 LV | 32% | 15% | 13% | 6% | - | 5% | - | 17% | Wiki |
| Lord Ashcroft Polls | Apr 28 - May 17, 2026 | 3,804 A | 32% | 13% | 22% | 7% | 5% | - | 3% | - | Wiki |
| AtlasIntel | May 4-7, 2026 | 2,069 A | 29.6% | 45.4% | 0.4% | 11.2% | - | - | - | - | Wiki |
| Verasight | Apr 21-23, 2026 | 802 A | 36.7% | 15.8% | 13.3% | 7.1% | - | 3.8% | 1.9% | 8.5% | Wiki |
| Echelon Insights | Apr 17-20, 2026 | 409 RV | 42% | 14% | 10% | 8% | 2% | - | 1% | 13% | Wiki |
| McLaughlin & Associates | Apr 8-15, 2026 | 457 RV | 35% | 15% | 13% | 7% | - | - | - | - | Wiki |
| Rasmussen Reports Not in average | Apr 9-13, 2026 | 385 LV | 47% | 20% | - | 7% | - | - | - | - | Wiki |
| YouGov | Apr 8-13, 2026 | 968 RV | 36% | 15% | 13% | 6% | - | - | - | - | Wiki |
| Harvard CAPS/Harris | Mar 25-26, 2026 | - | 42% | 17% | 20% | 10% | - | - | - | - | Wiki |
| Harvard CAPS/Harris | Feb 25-26, 2026 | 1,999 RV | 43% | 14% | 27% | 8% | - | - | - | - | Wiki |
| Echelon Insights | Feb 19-23, 2026 | 429 LV | 37% | 11% | 14% | 8% | 3% | 3% | 3% | 8% | Wiki |
| Echelon Insights Not in average | Feb 19-23, 2026 | 429 LV | 37% | 11% | 14% | 8% | 3% | 3% | 3% | 8% | Wiki |
| Emerson College | Feb 21-22, 2026 | 454 LV | 52% | 20% | - | 6% | 4% | 3% | 1% | 11% | Wiki |
| YouGov | Feb 13-18, 2026 | 463 RV | 51% | 15% | 8% | 9% | 2% | 2% | 2% | - | Wiki |
| Focaldata | Feb 10, 2026 | 1,148 RV | 52% | 9% | 14% | 8% | 6% | 3% | 3% | - | Wiki |
| Harvard CAPS/Harris | Jan 28-29, 2026 | 2,000 RV | 53% | 17% | 21% | - | - | - | - | - | Wiki |
| TIPP Insights | Jan 27-29, 2026 | 478 LV | 43% | 5% | 18% | 5% | - | 2% | 2% | - | Wiki |
| McLaughlin & Associates | Jan 21-27, 2026 | 442 LV | 42% | 4% | 16% | 7% | - | 4% | - | 16% | Wiki |
| Echelon Insights | Jan 22-26, 2026 | 430 LV | 40% | 6% | 12% | 7% | 4% | 5% | 1% | 11% | Wiki |
| Big Data Poll | Jan 22-24, 2026 | 1,306 RV | 46% | 7% | - | 10% | 7% | 5% | 4% | 11% | Wiki |
| YouGov | Jan 9-14, 2026 | 2,250 A | 41% | 7% | 11% | 8% | 1% | 1% | 2% | 17% | Wiki |
| Zogby Analytics | Jan 1-7, 2026 | 340 LV | 58% | 8% | - | 9% | - | - | 3% | 13% | Wiki |
| AtlasIntel | Dec 15-19, 2025 | 2,315 A | 46.7% | 22.6% | 1.6% | 13.4% | - | - | - | - | Wiki |
| McLaughlin & Associates | Dec 12-19, 2025 | 433 LV | 34% | 6% | 26% | 7% | - | 3% | - | 14% | Wiki |
| Echelon Insights | Dec 11-15, 2025 | 426 LV | 45% | 4% | 12% | 9% | 3% | 4% | 3% | 9% | Wiki |
| Big Data Poll Not in average | Dec 10-12, 2025 | 1,337 RV | 45% | 7% | - | 8% | 6% | 5% | 5% | 14% | Wiki |
| McLaughlin & Associates | Nov 17-24, 2025 | 439 LV | 34% | 4% | 24% | 6% | - | 6% | - | 15% | Wiki |
| Echelon Insights Not in average | Nov 13-17, 2025 | 472 LV | 47% | 8% | - | 10% | 5% | 5% | 2% | 12% | Wiki |
| Yale Youth Poll | Oct 29 - Nov 11, 2025 | 3,426 RV | 51% | 5% | 8% | 6% | 3% | 5% | - | 14% | Wiki |
| Morning Consult | Nov 7-9, 2025 | 936 RV | 42% | 3% | 19% | 7% | 3% | 5% | - | 18% | Wiki |
| YouGov | Nov 6-9, 2025 | 2,172 A | 42% | 5% | 13% | 7% | 3% | 1% | 4% | 17% | Wiki |
| Emerson College Not in average | Nov 3-4, 2025 | 420 RV | 53.6% | 6.1% | - | 1.7% | - | - | - | 25.4% | Wiki |
| Overton Insights | Oct 27-29, 2025 | 1,200 RV | 34% | 7% | 22% | 12% | 8% | 5% | - | 8% | Wiki |
| McLaughlin & Associates | Oct 21-27, 2025 | 458 LV | 38% | 7% | 20% | 5% | - | 4% | - | 14% | Wiki |
| Echelon Insights | Oct 16-20, 2025 | 400 LV | 46% | 6% | - | 10% | 5% | 6% | 2% | 15% | Wiki |
| J.L. Partners | Oct 14-15, 2025 | 1,000 RV | 40% | 8% | - | 7% | - | 5% | 4% | 20% | Wiki |
| Noble Predictive Insights | Oct 2-6, 2025 | 1,156 RV | 38% | 4% | 25% | 6% | - | 3% | 3% | 15% | Wiki |
| Leger360 | Sep 26-29, 2025 | 294 LV | 50% | 6% | - | - | - | - | 6% | 18% | Wiki |
| Echelon Insights | Sep 18-22, 2025 | 467 LV | 43% | 5% | - | 8% | 6% | 4% | 2% | 18% | Wiki |
| McLaughlin & Associates | Sep 17-22, 2025 | 470 LV | 42% | 5% | 14% | 8% | - | 3% | - | 19% | Wiki |
| AtlasIntel | Sep 12-16, 2025 | 1,066 A | 54.6% | 12.2% | 1.2% | 16.3% | - | - | - | - | Wiki |
| YouGov | Sep 5-8, 2025 | 1,114 A | 44% | 4% | 10% | 8% | 1% | 3% | 2% | 20% | Wiki |
| Leger360 | Aug 29-31, 2025 | 308 LV | 50% | 9% | - | - | - | - | 8% | 14% | Wiki |
| Emerson College | Aug 25-26, 2025 | 410 RV | 51.7% | 9.4% | - | 7.1% | 4.5% | 3.8% | 2.4% | 11.1% | Wiki |
| McLaughlin & Associates | Aug 21-26, 2025 | 457 RV | 36% | 4% | 16% | 10% | - | 3% | - | 18% | Wiki |
| Echelon Insights Not in average | Aug 14-18, 2025 | 441 LV | 43% | 6% | - | 9% | 9% | 4% | 2% | 15% | Wiki |
| AtlasIntel | Jul 13-18, 2025 | 1,935 A | 57.9% | 9.7% | 4.6% | 13.2% | - | - | - | - | Wiki |
| Echelon Insights Not in average | Jul 10-14, 2025 | 463 LV | 42% | 7% | - | 9% | 5% | 6% | 3% | 16% | Wiki |
| McLaughlin & Associates | Jul 9-14, 2025 | 459 LV | 31% | 4% | 19% | 8% | - | 4% | - | 21% | Wiki |
| Overton Insights | Jun 23-26, 2025 | 444 RV | 32% | 9% | 26% | 11% | 4% | 7% | - | 9% | Wiki |
| Emerson College | Jun 24-25, 2025 | 416 RV | 46% | 12% | - | 9% | 5% | 2% | <1% | 17% | Wiki |
| co/efficient Not in average | Jun 12-16, 2025 | 1,035 LV | 61% | 5% | - | 10% | - | - | - | 9% | Wiki |
| McLaughlin & Associates | Jun 10-15, 2025 | 455 LV | 36% | 4% | 14% | 6% | - | 4% | - | 24% | Wiki |
| AtlasIntel | May 21-27, 2025 | 1,044 A | 37.3% | 18.7% | 8.8% | 8% | - | - | - | - | Wiki |
| McLaughlin & Associates | May 21-26, 2025 | 457 LV | 34% | 5% | 19% | 5% | - | 4% | - | 22% | Wiki |
| J.L. Partners Not in average | May 13-14, 2025 | 975 RV | 46% | 6% | - | 8% | - | 5% | 6% | 13% | Wiki |
| Echelon Insights Not in average | May 8-12, 2025 | 426 LV | 44% | 4% | - | 7% | 6% | 8% | 4% | 13% | Wiki |
| McLaughlin & Associates | Apr 22-29, 2025 | 456 LV | 43% | 2% | 14% | 6% | - | 5% | - | 19% | Wiki |
| J.L. Partners Not in average | Apr 23-28, 2025 | 1,006 RV | 48% | 5% | - | 8% | - | 5% | 4% | 14% | Wiki |
| J.L. Partners Not in average | Apr 23-28, 2025 | 1,006 RV | 19% | 3% | - | 6% | - | 4% | 2% | 11% | Wiki |
| J.L. Partners | Apr 23-28, 2025 | 1,006 RV | 40% | 3% | 11% | 10% | - | 4% | 2% | 12% | Wiki |
| YouGov Not in average | Apr 21-23, 2025 | 1,296 A | 31% | 2% | 5% | 6% | 5% | 2% | 3% | 20% | Wiki |
| AtlasIntel Not in average | Apr 10-14, 2025 | 2,347 A | 60% | 9% | - | 9% | - | - | - | 6% | Wiki |
| Echelon Insights Not in average | Apr 10-14, 2025 | 1,014 LV | 47% | 4% | - | 9% | 7% | 4% | 1% | 16% | Wiki |
| Yale Youth Poll Not in average | Apr 1-3, 2025 | - | 19% | 2% | - | 4% | 4% | 3% | 1% | - | Wiki |
| Yale Youth Poll Not in average | Apr 1-3, 2025 | - | 53% | 3% | - | 8% | 9% | 4% | 3% | - | Wiki |
| YouGov | Mar 30 - Apr 1, 2025 | 594 RV | 43% | 4% | 11% | 8% | 2% | 3% | 2% | 20% | Wiki |
| Overton Insights | Mar 24-28, 2025 | 536 RV | 36% | 6% | 31% | 13% | - | - | - | - | Wiki |
| Echelon Insights | Mar 10-13, 2025 | 450 LV | 46% | 4% | - | 7% | 7% | 7% | 5% | 16% | Wiki |
| McLaughlin & Associates | Feb 11-18, 2025 | 468 LV | 37% | 3% | 17% | 6% | - | 3% | - | 22% | Wiki |
| Echelon Insights | Feb 10-13, 2025 | 466 LV | 39% | 4% | - | 10% | - | 8% | 4% | 20% | Wiki |
| McLaughlin & Associates | Jan 22-27, 2025 | 453 LV | 27% | 3% | 21% | 8% | - | 2% | - | 24% | Wiki |
| McLaughlin & Associates | Dec 11-16, 2024 | 463 LV | 25% | 2% | 21% | 9% | - | 4% | - | 24% | Wiki |
| Morning Consult | Dec 6-8, 2024 | 994 RV | 30% | 1% | 30% | 9% | 5% | 6% | - | - | Wiki |
| Emerson College Not in average | Nov 20-22, 2024 | 420 RV | 30% | 1% | - | 5% | 2% | 2% | 1% | 28% | Wiki |
| Echelon Insights | Nov 14-18, 2024 | 483 LV | 37% | 5% | - | 8% | - | 9% | 5% | 18% | Wiki |
| Echelon Insights | Jul 19-21, 2024 | 456 LV | 25% | 2% | - | 14% | - | 9% | 4% | 21% | Wiki |
| Echelon Insights | Jan 16-18, 2024 | 832 RV | 1% | - | - | 27% | - | 19% | - | 17% | Wiki |
How the average works
Decided voters only, rescaled to 100. The average uses polls from the last 60 days, weighting recent and larger polls more; partisan polls (R or D) count half. A poll that leaves out a candidate averaging 15% or more is not used.
Poll lists adapted from Wikipedia: Nationwide opinion polling for the 2028 Republican Party presidential primaries (revision 1383595386). Licensed under CC BY-SA 4.0; PollCheck averages are derived from them.
Photos: Donald Trump Jr. by Gage Skidmore from Surprise, AZ, United States of America, CC BY-SA 4.0 (source, cropped); others official portraits, public domain (US government); see Photo credits.
PollCheck US. Data through November 5, 2026. Photo credits