House districts / California
California's 24th congressional district
CA-24. Redrawn for 2026: the November 2026 election is on new lines. The new district is close to the 2024 one (under 2% of its area differs).
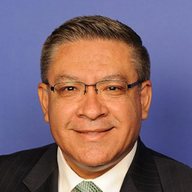
Fundraising
- Salud O. Carbajal Das of Oct 14, 2026Raised $1.9mSpent $1.2m · Cash $3.3m
- Robert Bob J Smith Ras of Oct 14, 2026Raised $347kSpent $290k · Cash $57k
1 other 2026 candidate filed reports (primary candidate). 1 other candidate has not filed.
Federal Election Commission, candidate totals, public domain.
President in this district
PollCheck calculation from precinct returns on the 2026 lines (method).
| Year | Democrat | Republican | Other | Margin |
|---|---|---|---|---|
| 2024 | Harris 60.9% | Trump 36.0% | 3.1% | D+25.0 |
| 2020 | Biden 63.3% | Trump 34.3% | 2.4% | D+29.0 |
| 2016 | Clinton 59.1% | Trump 34.0% | 6.9% | D+25.1 |
Who lives here
| Measure | This district | US |
|---|---|---|
| People | ||
| Population | 764,734 | |
| Adults (18+) | 611,943 | |
| Citizens, % of adults* | 88.4% | 92.1% |
| Age, % of adults | ||
| 18 to 29* | 26.3% | 20.3% |
| 30 to 44* | 22.4% | 25.9% |
| 45 to 64* | 27.9% | 31.8% |
| 65 and over* | 23.3% | 22.0% |
| Race and Hispanic origin, % of residents | ||
| White | 49.6% | 57.8% |
| Black | 1.5% | 12.1% |
| Hispanic | 38.7% | 18.7% |
| Asian | 5.0% | 5.9% |
| Other or more than one | 5.2% | 5.5% |
| Education and income | ||
| Bachelor's degree or higher, % of 25+* | 39.2% | 35.7% |
| Median household income* | $98,276 | $80,734 |
* Estimated for the 2026 lines from census blocks (ACS 2020-2024). Population, adults and race: 2020 Census, counted on the 2026 lines. The tick marks the US figure.
Winning margin
Results since 1976
| Year | Winner | Share | Runner-up | Share | Margin |
|---|---|---|---|---|---|
| 2024 lines, elections 2022-2024: redrawn for 2026 seat count changed from 53 to 52 after the census | |||||
| 2024 | Salud O. Carbajal Democrat | 62.7% | Thomas Cole Republican | 37.3% | D+25.4 |
| 2022 | Salud O. Carbajal Democrat | 60.6% | Brad Allen Republican | 39.4% | D+21.1 |
| Earlier lines, elections 2012-2020 post-census redistricting | |||||
| 2020 | Salud O. Carbajal Democrat | 58.7% | Andy Caldwell Republican | 41.3% | D+17.3 |
| 2018 | Salud O. Carbajal Democrat | 58.6% | Justin Fareed Republican | 41.4% | D+17.1 |
| 2016 | Salud Carbajal Democrat | 53.4% | Justin Donald Fareed Republican | 46.6% | D+6.8 |
| 2014 | Lois Capps Democrat | 51.9% | Chris Mitchum Republican | 48.1% | D+3.9 |
| 2012 | Lois Capps Democrat | 55.1% | Abel Maldonado Republican | 44.9% | D+10.2 |
| Earlier lines, elections 2002-2010 seat count changed from 52 to 53 after the census | |||||
| 2010 | Elton Gallegly Republican | 59.9% | Timothy J. Allison Democrat | 40.1% | R+19.9 |
| 2008 | Elton Gallegly Republican | 58.1% | Marta Ann Jorgensen Democrat | 41.9% | R+16.3 |
| 2006 | Elton Gallegly Republican | 62.0% | Jill M. Martinez Democrat | 38.0% | R+24.1 |
| 2004 | Elton Gallegly Republican | 62.8% | Brett Wagner Democrat others 3.3% | 33.9% | R+28.9 |
| 2002 | Elton Gallegly Republican | 65.2% | Fern Rudin Democrat others 3.1% | 31.8% | R+33.4 |
| Earlier lines, elections 1992-2000 seat count changed from 45 to 52 after the census | |||||
| 2000 | Brad Sherman Democrat | 66.0% | Jerry Doyle Republican others 4.2% | 29.8% | D+36.2 |
| 1998 | Brad Sherman Democrat | 57.3% | Randy Hoffman Republican others 4.2% | 38.5% | D+18.8 |
| 1996 | Brad Sherman Democrat | 49.4% | Rich Sybert Republican others 7.0% | 43.6% | D+5.8 |
| 1994 | Anthony C. Beilenson Democrat | 49.4% | Rich Sybert Republican others 3.1% | 47.5% | D+1.8 |
| 1992 | Anthony C. Beilenson Democrat | 55.5% | Tom McClintock Republican others 5.4% | 39.1% | D+16.4 |
| Earlier lines, elections 1982-1990 seat count changed from 43 to 45 after the census | |||||
| 1990 | Henry A. Waxman Democrat | 68.9% | John N. Cowles Republican others 5.5% | 25.6% | D+43.3 |
| 1988 | Henry A. Waxman Democrat | 72.2% | John N. Cowles Republican others 4.0% | 23.8% | D+48.5 |
| 1986 | Henry A. Waxman Democrat | 87.9% | George Abrahams Libertarian others 4.6% | 7.5% | D+80.4 |
| 1984 | Henry A. Waxman Democrat | 63.4% | Jerry Zerg Republican others 3.4% | 33.2% | D+30.2 |
| 1982 | Henry A. Waxman Democrat | 65.0% | Jerry Zerg Republican others 4.0% | 31.0% | D+34.1 |
| Earlier lines, elections 1976-1980 | |||||
| 1980 | Henry A. Waxman Democrat | 63.8% | Roland Cayard Republican others 9.1% | 27.1% | D+36.7 |
| 1978 | Henry A. Waxman Democrat | 62.7% | Howard G. Schaefer Republican others 4.8% | 32.6% | D+30.1 |
| 1976 | Heny A. Waxman Democrat | 67.8% | David Irving Simmons Republican | 32.2% | D+35.6 |
More on California
Other California districts
About these results
Shares count all candidate votes, including write-ins, with a candidate's votes on several party lines added together. Each result is on the lines in force at the time. Mid-decade redraws before 2016 may be unmarked.
President in this district: 2016 and 2020, and 2024 on the new lines, are estimates: precinct votes are split between districts by census block.
Counties only partly inside the district show the 2024 result for that part; estimates are labelled.
Margin chart: winner minus runner-up. Gaps are unopposed races; dashed lines are new district lines.
Who lives here (2026 lines) is estimated from Census survey figures split by population.
Sources
Results: MIT Election Data and Science Lab, U.S. House 1976-2016 (doi:10.7910/DVN/IG0UN2, CC0; via MEDSL/constituency-returns), and Clerk of the US House, Statistics of the Presidential and Congressional Election 2018-2024 (public domain).
Presidential results: PollCheck calculation from MIT Election Data and Science Lab 2024 precinct returns (doi:10.7910/DVN/XDJYKC, doi:10.7910/DVN/USBYR4, CC0; state totals doi:10.7910/DVN/42MVDX, CC0) and Voting and Election Science Team 2016 and 2020 precinct results and shapes (doi:10.7910/DVN/NH5S2I, doi:10.7910/DVN/K7760H, CC BY 4.0), with US Census Bureau 2020 block populations and block equivalency files (public domain). Official figures: Texas Legislative Council (2024 on the 2026 lines); Louisiana, New Jersey, California and Washington election offices (county totals). Certified results transcribed by Wikipedia (CC BY-SA 4.0): Maine 2024 by district: 2024 United States presidential election in Maine (revision 1382530995); Indiana county totals: 2024 United States presidential election in Indiana (revision 1382505975); Oregon county totals: 2024 United States presidential election in Oregon (revision 1382605746).
District lines: US Census Bureau TIGER/Line 2026 (120th Congress) and 2025 cartographic boundary files (119th Congress), public domain.
Members: unitedstates/congress-legislators (CC0).
Counties: US Census Bureau 2024 cartographic boundary file (public domain); 2024 county results summed from the same MEDSL precinct returns, with the official county totals above.
Demographics: US Census Bureau, American Community Survey 5-year estimates 2020-2024; 2020 Census P.L. 94-171 (public domain).
2028 candidates: Federal Election Commission (public domain).
Photos: official portraits, public domain (US government); see Photo credits.
PollCheck US. Data through November 5, 2026. Photo credits